

memanto ui
Launch the interactive web dashboard. Provides UI for managing agents, memories, and sessions.
Examples:
Launch dashboard on default port:
- View all agents
- Create and view agents
- Manage sessions
- Store memories (UI form)
- Search/recall memories
- View memory statistics
- Monitor daily summaries
- View conflicts
UI Walkthrough
The screenshots below focus on the parts of the UI that are most important for day-to-day workflow.Dashboard Home
The Dashboard Home provides a high-level overview of your Memanto workspace. The left sidebar is your primary navigation menu, while the main grid displays cards with key metrics and configuration summaries. For deeper agent management workflows, see Agent Commands.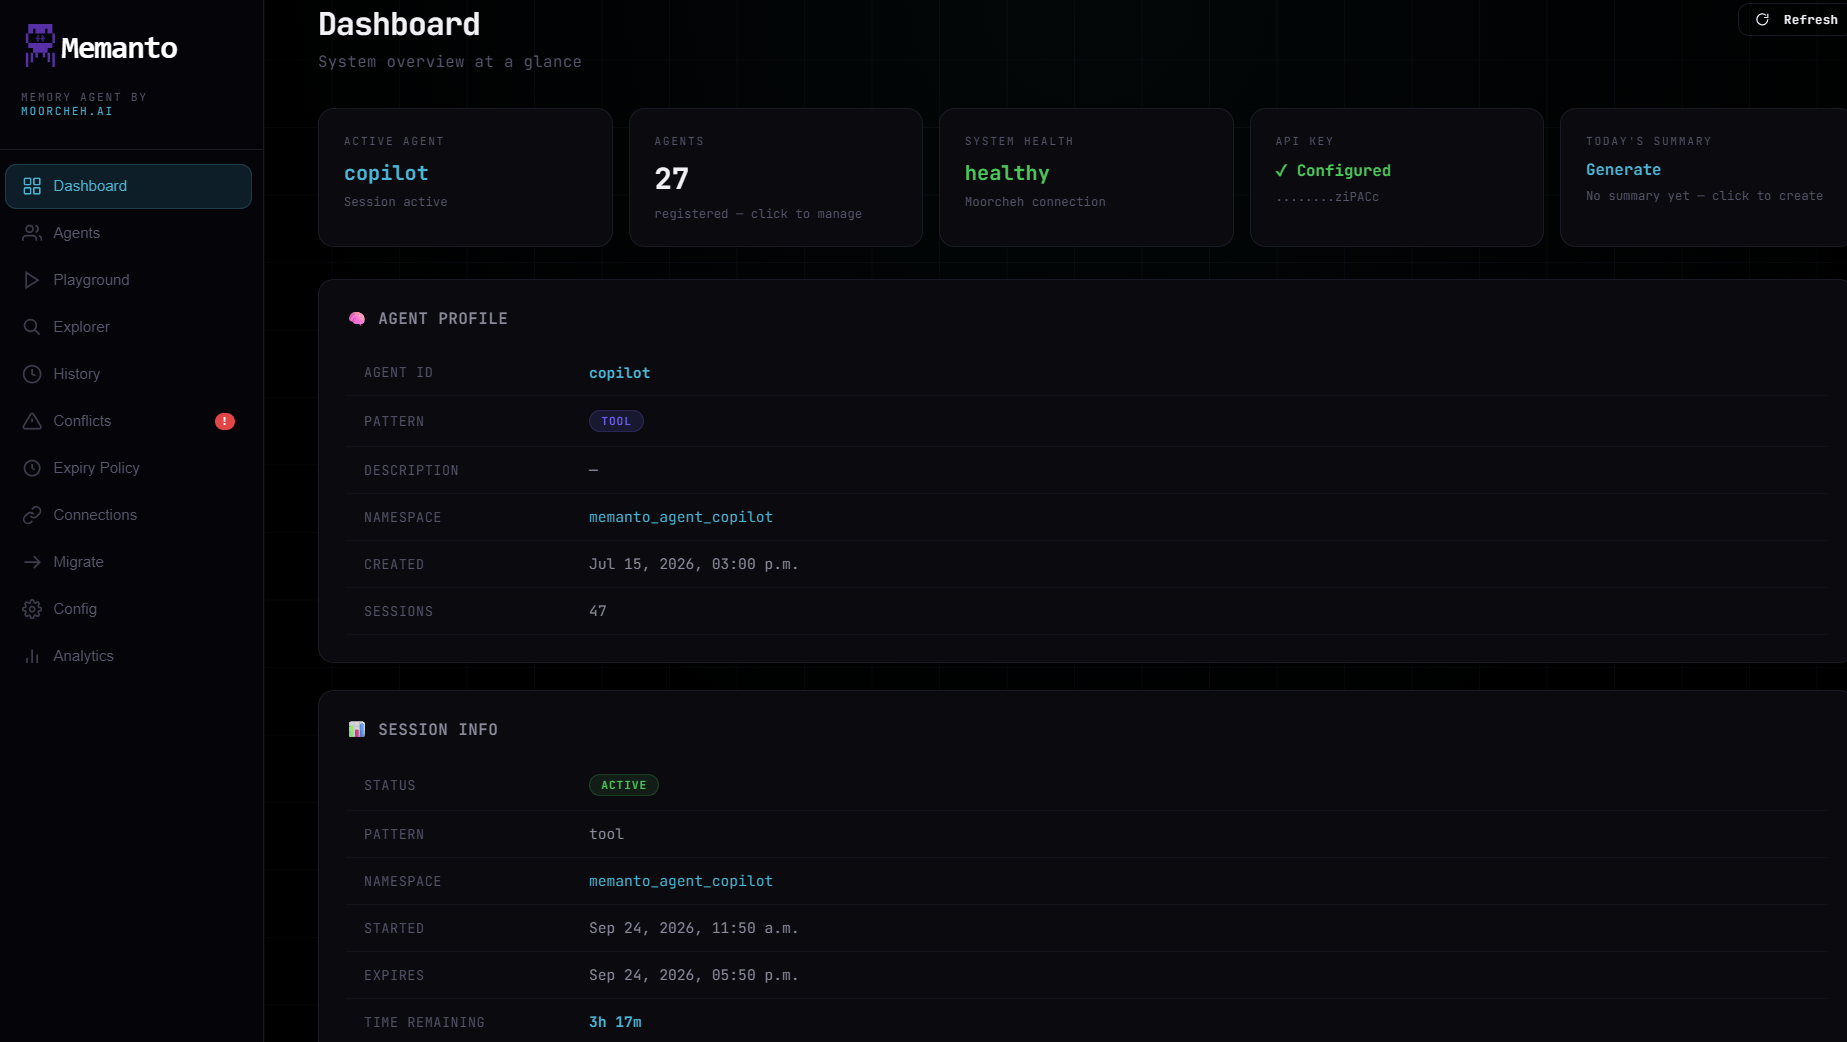
1
2
3
4
- Active agent card: Confirms which agent context is currently loaded.
- System health card: Quick check of service and connection health.
- Agent profile panel: Core metadata for the active agent.
- Session info panel: Session status, timing, and namespace details.